Even though the Kohonen's SOFM is pretty straight forward, there is still
things that can go wrong. This is described in the first part of this chapter,
the second part are some general graphs and the third part is the result of all
the data sets. This is quite an amount of graphs, but many very interesting.
Well, who said that problems do not exist? Here is the proof that they not
even exist, they are also quite annoying.
[ toc |
previous | next |
up ]
There where some difficulties how to represent the output of the network. First every neuron that was a winner for a certain output was
coloured in a separate colour for this output. This showed a some interesting things, but because the outputs overwrite each other this didn't show quite what was expected. Instead the distribution of the output was written as a table and plotted as a 3D graph. This made it much easier to see the clusters in the output. Some different number of neurons in the output layer was tested, from 3x3 to 100x100 and 13x13 seemed to be suitable for this purpose.
[ toc |
previous | next |
up ]
The Protein data set is huge, and the nettalk is even many times larger. This
inflicts problems in memory management. First a simple linked list was made and
to access each element (each element contains one row of the data set) of the
list it was required to loop through all data. In the case of 21,000 elements
this was quite tedious and took about 1/10 of a second for one element, this is
because of the way a RISC-computer architecture is constructed (there is no way
35MB of data will fit into the processor cache). That means that to just perform
a simple task to all of the elements in the list, it would take several minutes.
This of course had to be changed, and a quick jumping table was programmed.
[ toc |
previous | next |
up ]
This is also one very interesting point. In the Kohonen Network there is the
need to calculate winning output neuron. This is done by summering all the
neuron's weights errors and compare them with each other. The method that is
often used is the Root Mean Square method, which means that each weight error is
squared and then the resulting value is the square root of the sum of all the
squared errors.

The square
and the square root functions actually take a considerably large time to
execute. In the resulting Kohonen program we have therefore only used the sum of
all the absolute value errors.

This makes
the program execute seven times faster, which is several days of processor
computing when organizing the protein data set.
[ toc |
previous | next |
up ]
A collection of some general graphs that are common for all of the later
graphs.
To actually get a picture whether this Kohonen model works or not, this animated gif of
one of the wine representations was made. It clearly shows that the data is
moved in a satisfying manner.
 |
| Animated gif over the change of Kohonen output layer in
time. |
[ toc |
previous | next |
up ]
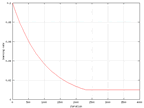
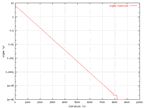
Because of some values changed in time, data from these values where collected.
In the graphs below. The change of the learning rate and the sigma value from
the wine data can be seen and they are the same in all sets.
 |
 |
| The change of the learning rate in time for the wine
output. |
The change of the sigma value in time for the wine
output. |
[ toc |
previous | next |
up ]
Another change in time that is relevant to look at is the change of the weights.
This can be seen below, again from the wine data set and there is no big
difference between some of the sets as well.
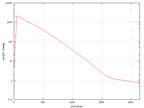 |
| The change of the weights in time for the wine output. |
[ toc |
previous | next |
up ]
The difference of output values showed that it was rather hard to see if there
was a good classification if there was many variations of the output. The difference
can be seen in a comparison between the output of the mushroom data and the
isolet data. Both are rather easy problems and the output of the mushroom data
shows this, but the isolet data is much harder to tell if it’s an easy
or hard problem.
All the figures in the data set section below shows the distribution of the
neurons in the output layer in the Kohonen network for each possible output
after 2000 iterations.
[ toc |
previous | next |
up ]
All the data sets are represented in different ways. This led to that each
data files had to be treated in special way. This is discussed in the readfile.c
section. The things that differs are the number of inputs, the number of outputs,
the type of the elements (characters, integers or decimal numbers) and the number
of variations of the output. All the data sets are briefly explained later.
Because of the difference in the amount of data the time it took to run the
program varied very much. The echo data only took a minute or so and the nettalk
data took so long time to run that some data had to be deselected. To do this
a random function with a possibility of 95 percent to skip one row the data
was used. That led to a data set of 5 percent of the original, which even then
took about twelve hours to run. All the sets were trained 2000 times with the
training set and in a certain interval output data were collected. This gets
an output like the one below that change during time and gets more and more
stable.
All data was normalized before presented to the network, this means that all
of the different dimensions will have the same impact on the system. The
normalization range chosen for the Kohonen Network was 0 to 1.
[ toc |
previous | next |
up ]
This data set was donated by Steve Salzberg (salzberg@cs.jhu.edu) and shows
echocardiogram information from 132 patients that suffered heart attacks. The
problem is to predict if the patient will not survive one year after the attack.
Part of the difficulty to do this is because of the size of the training set,
it only contains 4 patients that did not survive the first year and 36 of the
patients can not be part of the training because they wasn’t followed
one whole year. Each element in the set contains 13 numerical values, of which
four are meaningless and two are used to get the output. That means that there
are 7 inputs and one output which can be 0 or 1. Earlier work has shown that
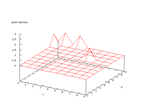
at least about 60 percent correctness is possible. The output of the Kohonen
network below shows that there are only 4 outputs that are 0, but it also shows
that they are relatively close which means that it is possible to a rough classification
of the data, but it would probably be better with a larger training set.
 |
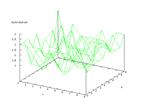 |
| Figure 4 output layer from the Kohonen network that shows the distribution of
patients that died during the first year after the heart attack |
Figure 5 output layer from the Kohonen network that shows the distribution of
the patients that survived at least one year after the heart attack |
[ toc | previous |
next |
up ]
The responsible for these sets are Andras Janosi, M.D at Hungarian Institute
of Cardiology. Budapest, William Steinbrunn, M.D at University Hospital, Zurich,
Switzerland, Matthias Pfisterer, M.D at University Hospital, Basel, Switzerland
and Robert Detrano, M.D., PhD at V.A. Medical Center, Long Beach and Cleveland
Clinic Foundation. The sets contain data from 4 databases concerning heart diagnostics.
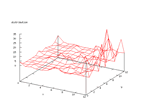
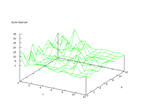
The set are divided in 14 variables of which the last is the presence of heart-disease
where 0 is absence and 1, 2, 3 and 4 are presence. The problem is to find a
presence or absence of heart-disease of the data. Earlier work has shown that
at least about 75 - 80 percent correctness is possible. The output from the
Kohonen network below shows that there is a higher density in the distribution
of the two output possibilities, but it is not an absolutely clear
distribution
which means that there is some source of error that can be hard to predict.
 |
 |
| Figure 6 output layer from the Kohonen network that shows the distribution
of absence of heart-disease |
Figure 7 output layer from the Kohonen network that shows the distribution
of presence of heart-disease |
[ toc | previous |
next |
up ]
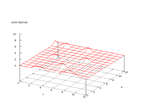
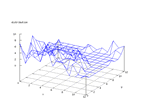
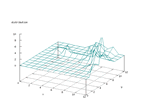
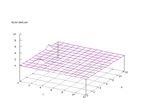
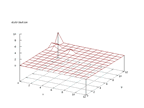
This set was donated by John Stutz, stutz@pluto.arc.nasa.gov. The problem is
to classify infra red spectra into 10 main classes. The inputs are 93 flux measurements
from two different frequencies observed by the infra-red astronomy satellite.
As can be seen below some classes are not very well represented in the set.
Therefore some of the classes may be hard to distinguish
 |
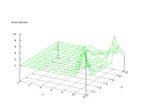 |
| Figure 8 output layer from the Kohonen network that shows the distribution of the first basic class |
Figure 9 output layer from the Kohonen network that shows the distribution of the second basic class |
 |
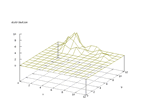 |
| Figure 10 output layer from the Kohonen network that shows the distribution of the third basic class |
Figure 11 output layer from the Kohonen network that shows the distribution of the fourth basic class |
 |
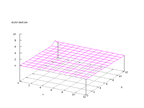 |
| Figure 12 output layer from the Kohonen network that shows the distribution of the fifth basic class |
Figure 13 output layer from the Kohonen network that shows the distribution of the sixth basic class |
 |
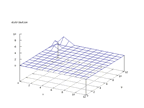 |
| Figure 14 output layer from the Kohonen network that shows the distribution of the seventh basic class |
Figure 15 output layer from the Kohonen network that shows the distribution of the eighth basic class |
 |
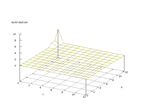 |
| Figure 16 output layer from the Kohonen network that shows the distribution of the ninth basic class |
Figure 17 output layer from the Kohonen network that shows the distribution of the tenth basic class |
[ toc | previous |
next |
up ]
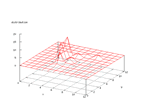
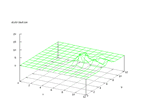
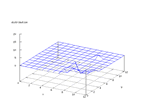
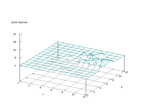
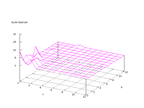
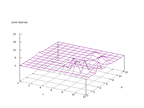
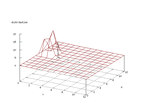
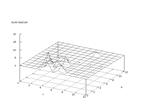
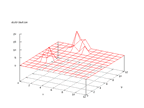
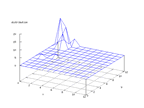
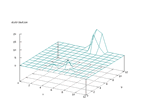
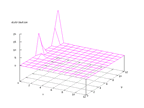
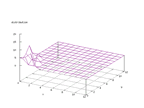
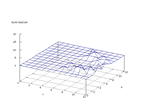
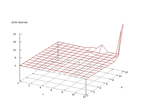
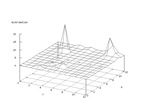
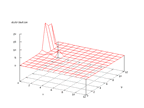
This set was donated by Tom Dietterich, tgd@cs.orst.edu. The set contains data
from 150 subjects that spoke the name of each letter of the English alphabet
twice. The problem is to predict which letter name was spoken. This is, according
to the information on the set, a rather simple task, but because of its many
different output signals it gets a little bit difficult to separate the outputs
from the Kohonen network. Even tough it can be seen that the distribution of
each output value are rather concentrated, it is not as clear as for example
the mushroom data.
 |
 |
| Figure 18 output layer from the Kohonen network that shows the distribution
of the letter A |
Figure 19 output layer from the Kohonen network that shows the distribution
of the letter B |
 |
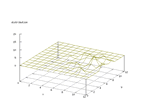 |
| Figure 20 output layer from the Kohonen network that shows the distribution
of the letter C |
Figure 21 output layer from the Kohonen network that shows the distribution
of the letter D |
 |
 |
| Figure 22 output layer from the Kohonen network that shows the distribution
of the letter E |
Figure 23 output layer from the Kohonen network that shows the distribution
of the letter F |
 |
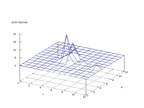 |
| Figure 24 output layer from the Kohonen network that shows the distribution
of the letter G |
Figure 25 output layer from the Kohonen network that shows the distribution
of the letter H |
 |
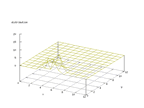 |
| Figure 26 output layer from the Kohonen network that shows the distribution
of the letter I |
Figure 27 output layer from the Kohonen network that shows the distribution
of the letter J |
 |
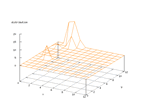 |
| Figure 28 output layer from the Kohonen network that shows the distribution
of the letter K |
Figure 29 output layer from the Kohonen network that shows the distribution
of the letter L |
 |
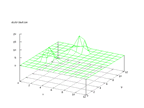 |
| Figure 30 output layer from the Kohonen network that shows the distribution
of the letter M |
Figure 31 output layer from the Kohonen network that shows the distribution
of the letter N |
 |
 |
| Figure 32 output layer from the Kohonen network that shows the distribution
of the letter O |
Figure 33 output layer from the Kohonen network that shows the distribution
of the letter P |
 |
 |
| Figure 34 output layer from the Kohonen network that shows the distribution
of the letter Q |
Figure 35 output layer from the Kohonen network that shows the distribution
of the letter R |
 |
 |
| Figure 36 output layer from the Kohonen network that shows the distribution
of the letter S |
Figure 37 output layer from the Kohonen network that shows the distribution
of the letter T |
 |
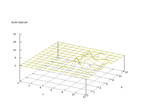 |
| Figure 38 output layer from the Kohonen network that shows the distribution
of the letter U |
Figure 39 output layer from the Kohonen network that shows the distribution
of the letter V |
 |
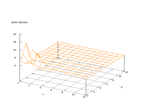 |
| Figure 40 output layer from the Kohonen network that shows the distribution
of the letter W |
Figure 41 output layer from the Kohonen network that shows the distribution
of the letter X |
 |
 |
| Figure 42 output layer from the Kohonen network that shows the distribution
of the letter Y |
Figure 43 output layer from the Kohonen network that shows the distribution
of the letter Z |
[ toc | previous |
next |
up ]
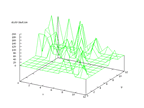
This set was donated by Jeff Schlimmer, jeffrey.schlimmer@a.gp.cs.cmu.edu, and
contains data from 8124 mushrooms and consist of 22 nominally values and a class
attribute (edible or poisonous). The problem is to predict if a mushroom is
edible or poisonous. Earlier work has shown that it is possible to 95 percent
classification accuracy and the output from the Kohonen network below shows
that the two different classes are clearly distinguishable.
 |
 |
| Figure 44 output layer from the Kohonen network that shows the distribution
of the edible mushrooms |
Figure 45 output layer from the Kohonen network that shows the distribution
of the poisonous mushrooms |
[ toc | previous |
next |
up ]
This set is allowed to use for non-commercial research purposes by Johns Hopkins
University and contains the 1000 most common English words and how they are
pronounced. The problem is to predict how each letter is pronounced. In earlier
attempts to solve this problem a window of seven letters have been used where
each letter is an array of 26 Booleans, one for each letter in the English alphabet,
all together 182 inputs was used. There are two different outputs, one for which
letter and one for how the letter should be pronounced, that is 260 different
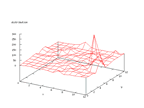
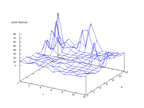
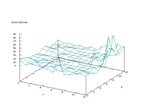
variants of output. Because of this the Kohonen output would be very hard to
analyze, so a different approach was used to do it. Only the difference in the
pronouncing was written as output from the network as the graphs below shows.
 |
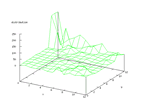 |
| Figure 46 output layer from the Kohonen network that
shows the distribution of > of the second output |
Figure 47 output layer from the Kohonen network that
shows the distribution of < of the second output |
 |
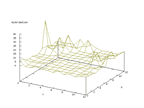 |
| Figure 48 output layer from the Kohonen network that shows the distribution
of 0 of the second output |
Figure 49 output layer from the Kohonen network that shows the distribution
of 2 of the second output |
 |
|
| Figure 50 output layer from the Kohonen network that shows the distribution
of 1 of the second output |
|
[ toc | previous |
next |
up ]
This set is allowed to use for non-commercial research purposes by Johns Hopkins
University and contains data from a number of proteins, which consists of 20
amino acids with a following secondary structure. The secondary structure can
be of three types, alpha-helix, beta-sheet and random-coil. It is not clear
from the task which symbol that represents what secondary structure, so the
symbol rather than the name is used later in the report. The problem is to predict the secondary structure
given the amino acid sequence.
There was only minor corruption in the two files and the corruption is more
like inconsistencies in the file format. Some of the 'end' tags were missing and
the format of the 'end' tags were different in the two files. This was corrected
in the data files before they were used as input to the program.
The training data consists of 18,105 amino acids with corresponding structure and the test data (used as
validation and not used for training) consists of 3,520 amino acids with
corresponding structure. Each data set row has a
fixed number of previous and subsequent amino acids exactly like the nettalk
approach. A window size (number of elements per row) of 7 and 21 was tried and
also different representations for the data was used. The first representation
tried was to use one float for each row element or 7 and 21 inputs respectively.
The other approach is to present the data with 20 Boolean values for each row
element, this would result in 7*20 and 21*20 inputs respectively. The 420 input
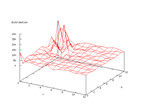
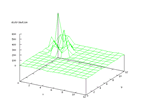
version was used to produce the following graphs.
 |
 |
| Figure 51 output layer from the Kohonen network that shows the distribution
of the secondary structure _ |
Figure 52 output layer from the Kohonen network that shows the distribution
of the secondary structure e |
 |
|
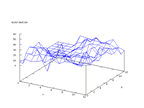
| Figure 53 output layer from the Kohonen network that shows the distribution
of the secondary structure h |
|
This results really suggest that the secondary structure 'h' is very easy to
distinguish from the rest of the data.
[ toc | previous |
next |
up ]
The set contains data from sonar signals. The problem is to predict if the signal
comes from a rock or a mine. The set contains of 208 rows of data and earlier
work has shown that it is possible to classify the data very well, almost up
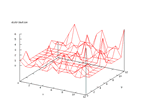
to 90 percent. The output from the Kohonen network below shows that there are
some distinctive differences in the outputs, but that there is also some overlapping
in the distributions.
 |
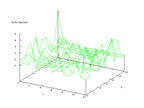 |
| Figure 54 output layer from the Kohonen network that shows the distribution
of rock output |
Figure 55 output layer from the Kohonen network that shows the distribution
of mine output |
[ toc | previous |
next |
up ]
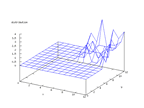
This set comes from Stefan Aeberhard, stefan@coral.cs.jcu.edu.au, and contains
data from a chemical analysis of 178 different wines from three different cultivars.
The inputs are 13 numerical values and the problem is to predict which cultivar
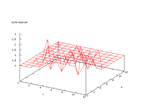
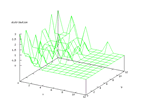
the wine belongs to. The output from the Kohonen network below shows that this
is a very easy set to classify and earlier work has shown that it is possible
to predict the cultivar to almost 100 percent.
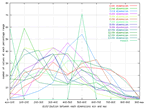 |
| The dimensional normalized distribution of the wine data set. |
As can be seen from this graph, all the data dimensions are well distributed
over the input space. This can be important to se so there is not one small
value that is skewing all the data to one corner.
 |
 |
| Figure 56 output layer from the Kohonen network that shows the distribution
of the first class of wines |
Figure 57 output layer from the Kohonen network that shows the distribution
of the second class of wine |
 |
|
| Figure 58 output layer from the Kohonen network that shows the distribution
of the third class of wine |
|
[ toc | previous |
next |
up ]
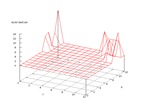
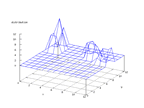
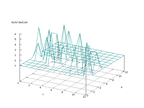
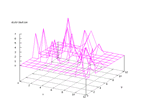
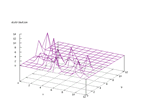
The set was collected by David Deterding at the University of Cambridge, who
recorded examples of the eleven steady state vowels of English spoken by fifteen
speakers for a speaker normalization automatic speech recognition. The problem
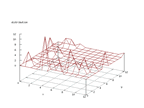
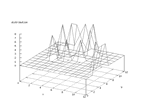
is to predict the eleven steady state vowels. The output from the Kohonen network
below shows that there are some clear classifications, but they are all overlapping
a little bit, this could make it hard to separate the different vowels.
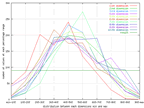 |
| The dimensional normalized distribution of the wine data set. |
As can be seen from this graph, all the data dimensions are well distributed
over the input space. The distribution is almost following the normal
distribution this is a quite good sign, and suggests that the data is well
represented..
 |
 |
| Figure 59 output layer from the Kohonen network that shows the distribution
of the first of the vowels |
Figure 60 output layer from the Kohonen network that shows the distribution
of the second of the vowels |
 |
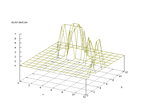 |
| Figure 61 output layer from the Kohonen network that shows the distribution
of the third of the vowels |
Figure 62 output layer from the Kohonen network that shows the distribution
of the fourth of the vowels |
 |
 |
| Figure 63 output layer from the Kohonen network that shows the distribution
of the fifth of the vowels |
Figure 64 output layer from the Kohonen network that shows the distribution
of the sixth of the vowels |
 |
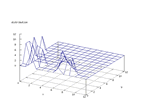 |
| Figure 65 output layer from the Kohonen network that shows the distribution
of the seventh of the vowels |
Figure 66 output layer from the Kohonen network that shows the distribution
of the eighth of the vowels |
 |
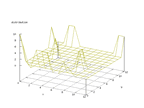 |
| Figure 67 output layer from the Kohonen network that shows the distribution
of the ninth of the vowels |
Figure 68 output layer from the Kohonen network that shows the distribution
of the tenth of the vowels |
 |
|
| Figure 69 output layer from the Kohonen network that shows the distribution
of the eleventh of the vowels |
|
[ toc | previous |
next |
up ]


